✅ Learn How to Create a Power BI Report Quickly and Easily | Power BI Tutorial
Looking for a fast and simple way to create a report in Power BI? There’s a new feature that lets you visualize SharePoint or Microsoft Lists directly in Power BI — in just one minute.
In this step-by-step tutorial, you’ll learn how to create a report with Power BI, perfect for anyone who wants to generate Power BI reports from SharePoint / Microsoft Lists with just a few clicks.
🧭 What Will You Learn in This Power BI Tutorial?
- How to create a Power BI report from SharePoint in 5 simple steps
- A practical example of Power BI reports for businesses
- How to publish and save Power BI reports to the cloud
- Tips to make the most of this business intelligence (BI) tool
👨💻Learn an easy way to use Power BI to build a quick report.👩💻 | 5 Steps
Create a Power BI Report in 1 Minute: Step-by-Step
1. Open your list in Microsoft Lists / SharePoint
Select the list you want to use to create a Power BI report.
2. Click on “Integrate” → Power BI
In SharePoint, go to the top menu and select:
Integrate > Power BI > Visualize the list
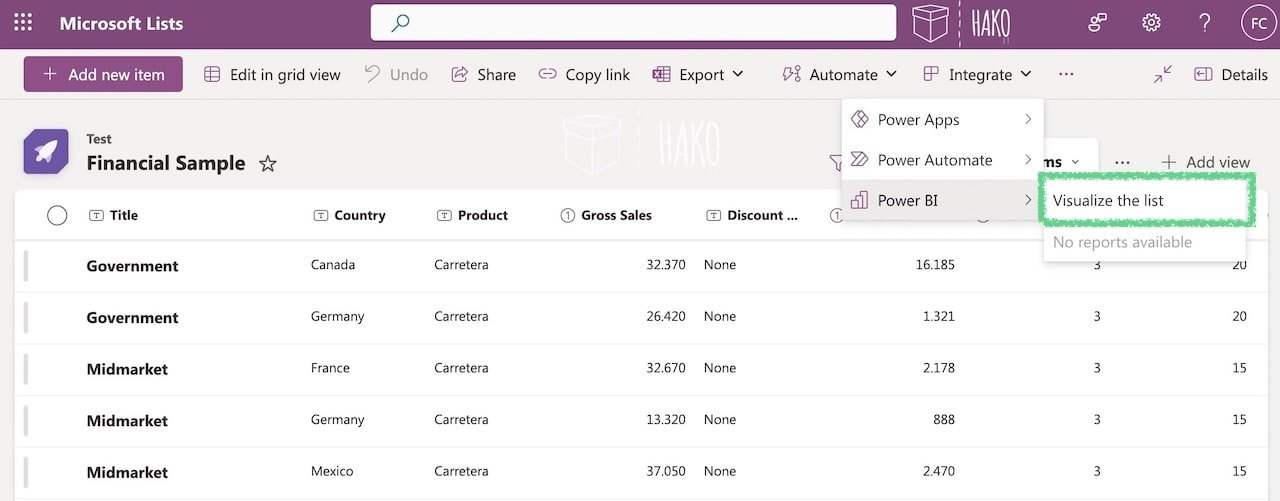
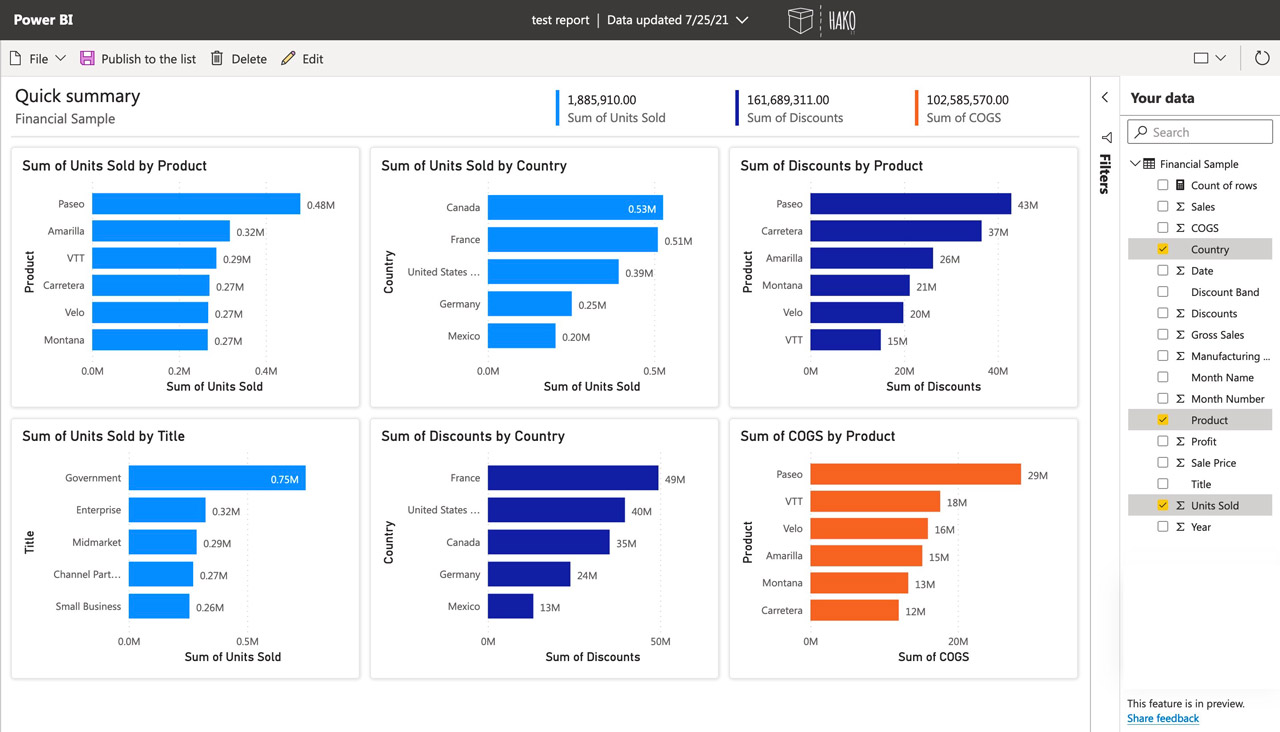
3. Automatically Visualize Your Report in Power BI
An interactive Power BI report will be generated automatically, which you can customize to fit your needs.
4. Save / Publish Your Power BI Report
Click on File > Save a copy or choose Publish to share the report with your team.
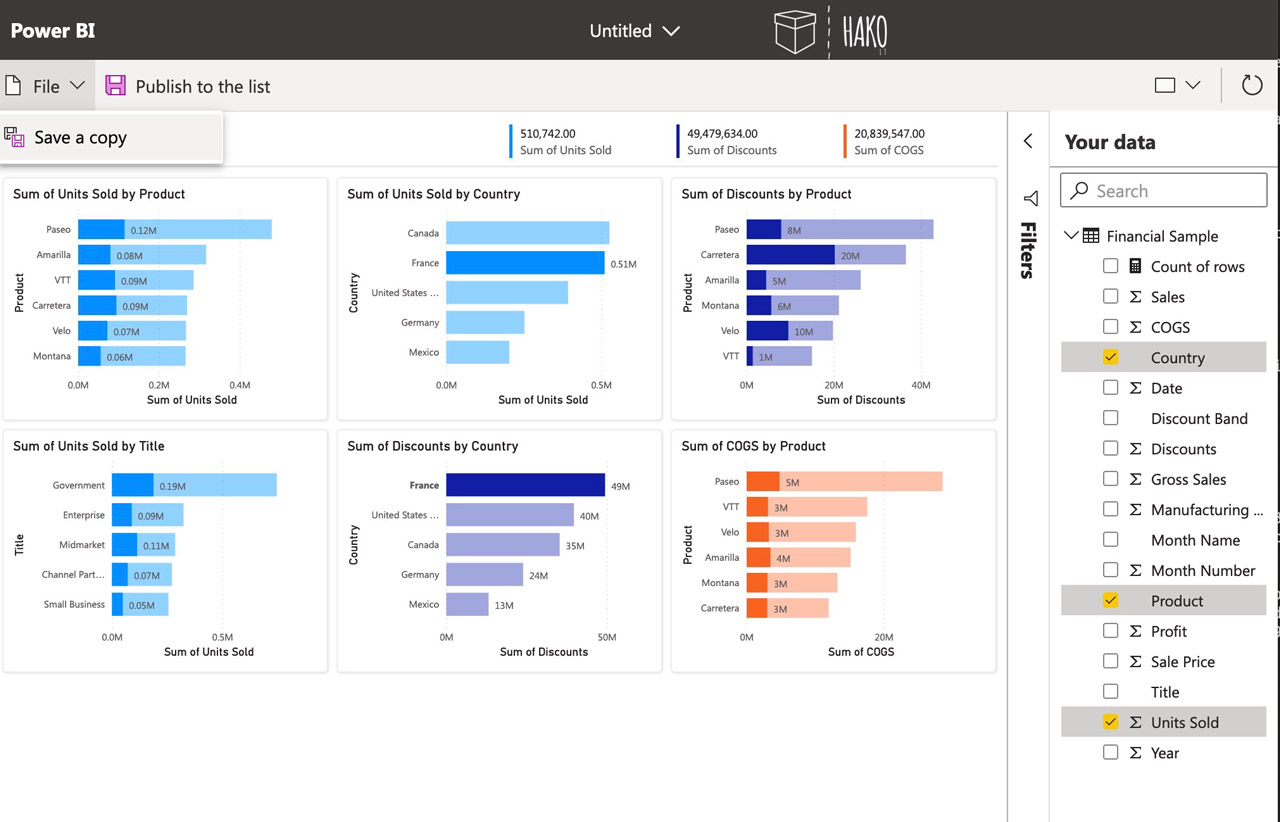
5. Enter a Name and You’re Done!
Type a name for your Power BI report and click Publish to the list — it’s that simple.
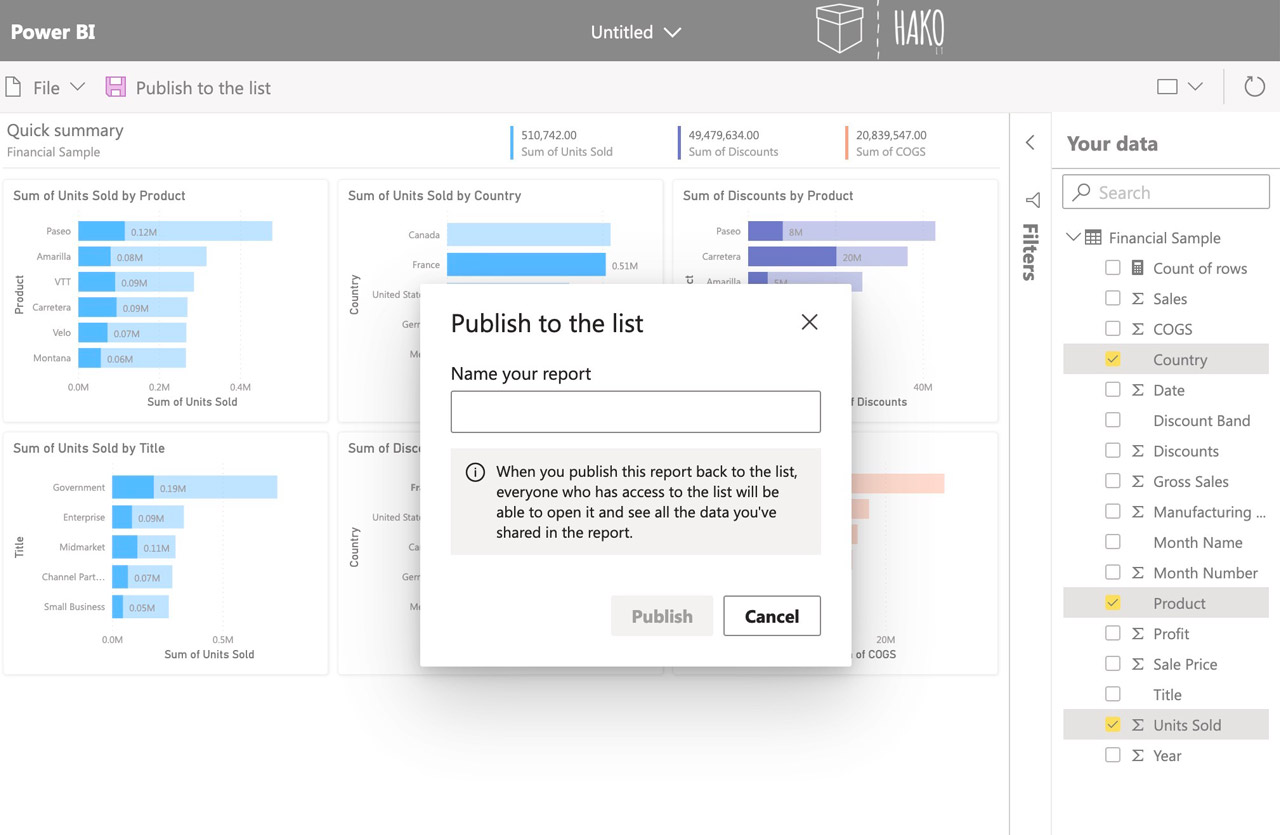
Explore your data & Enjoy it!.
Important: The reports saved and published will not be visible within the Power BI service.
🤔 You’ll find these published reports on the Integrate menu of the Sharepoint list.👇👇
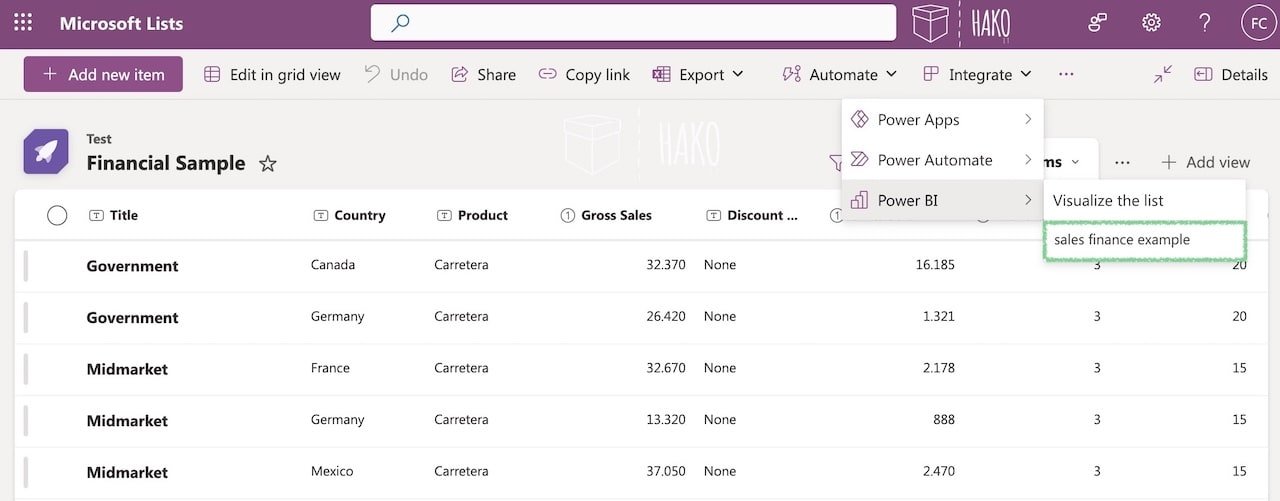
How to Create a BI Report with Power BI from SharePoint / Microsoft Lists |
Video Tutorial
📌 This is an excellent option for those looking for:
- How to easily create reports in Power BI
- Examples of Power BI reports from SharePoint
- What you can do with Power BI for data analysis
Benefits of Using Power BI for Business Reporting
- Get visual, interactive, and real-time Power BI reports.
- Improve decision-making with automated data analysis.
- Ideal for businesses looking for Power BI report examples with minimal technical effort.
- Its new integration with Microsoft Fabric makes it an even more powerful solution.
🚀 Achieve powerful results by listening to your data.
📖 Studies show that companies using business intelligence (BI) analytics make faster, data-driven decisions.
Every company is unique, so every BI project must be unique.
We will help you throughout the process, always adapting to your needs. Contact us for more information.
Frequently Asked Questions About Creating a Power BI Report
How do I create a report in Power BI from SharePoint?
You can create a report in Power BI from SharePoint by opening your list, clicking “Integrate > Power BI > Visualize the list,” and an interactive report will be automatically generated—ready to edit, save, or publish.
What do I need to create a Power BI report in 1 minute?
You only need a list in SharePoint or Microsoft Lists, access to integrated Power BI, and to follow the 5 steps outlined in our step-by-step tutorial. It’s fast, easy, and requires no advanced technical skills.
What types of reports can be created with Power BI?
With Power BI, you can create business reports, interactive dashboards, real-time data analysis, and automatic visualizations from data sources like Excel, SharePoint, SQL Server, and more.
Is Power BI integrated with Microsoft Lists?
Yes, Power BI is now directly integrated with Microsoft Lists and SharePoint, allowing users to automatically generate reports without needing to open Power BI Desktop. Perfect for Office 365 users.
Where are reports created in Power BI from SharePoint stored?
Reports generated from SharePoint do not appear directly on the main Power BI dashboard. You must save a copy or publish them manually to access them later.
Can I share a Power BI report with my team?
Yes, once the report is created, you can click “Publish” to share it with your team directly from the Power BI Online interface.
Why use Power BI for business reporting?
Power BI provides fast, visual, and accurate insights. It helps companies make data-driven decisions, automates analysis, and facilitates team collaboration.
Where can I learn more about Power BI?
At the end of the article, you’ll find links to more Power BI tutorials, including what Power BI is, how to use Microsoft Fabric, and how to make the most of Power BI Embedded.
Conclusion
Creating reports in Power BI from SharePoint / Microsoft Lists is quick, easy, and effective. In just 60 seconds, you can have an interactive BI report to support better decision-making.
👉 Get started today and discover the power of Power BI for your business.
Power BI Tutorials: Unlock the Power of Data!
Check out these must-see beginner tutorials and start transforming data into insights today! Get step-by-step guidance, tips, and tricks to master Power BI like a PRO 👨💻👩💻:
Microsoft Power BI – A Comprehensive Introduction
Create a Report in 60 Seconds with Power BI | Power BI Tutorial
Microsoft Fabric Basics: A Comprehensive Guide to Modern Data Analytics
How to use Power BI Embedded – Tutorial Step by step | Microsoft Power BI
Need Help with Your Business Intelligence Projects?
Every company is unique. At Hako IT, we offer personalized BI consulting, helping you design and implement Power BI reports tailored to your business or industry.


